ifconfig.me speed test — 20 Oct 2026
Measured from the wfix.shop server on 20 October 2026 at 13:04 UTC. Grade A (91/100), with the screenshots, the timings and the fixes that matter.
Where the first byte went
- DNS lookup 58 ms 19%
- TCP connect 54 ms 18%
- Server wait 190 ms 63%
Measured on the connection that fetched the HTML. Every other request on the page waits for the end of this bar before it can start.
How this page compares
Every report published here is in this comparison, so it is a reference population of pages tested from one server - not a benchmark of the whole web.
What these numbers mean
- The first byte arrived in 301 ms. That is workable, and the cheapest win left is caching or a warmer connection.
- The page transfers 37.7 KB over 6 request(s), which is lean. Javascript files are 72% of it, so defer what is not needed for the first screen, and drop tags nobody uses.
- It runs over HTTP/3, so the assets share a connection instead of opening one each.
- 72% of the weight comes from other hosts (analytics, fonts, embeds), which also means their slow day becomes your slow day.
- The largest element painted at 592 ms, inside the 2.5 s Google calls good.
- Layout stayed still (CLS 0.009), so nothing jumps under the reader's cursor.
Fix first: Compress text responses - Turn on brotli (preferred) or gzip for text/css, javascript and text/html in the web server. This is the cheapest win available on almost any site.
Read on one shared server, not a visitor's phone: use it to compare pages against each other, not as a promise about every connection. We fix what these tests find.
Screenshot
What the page looks like
Loaded in headless Chromium on this server. Click an image to open it full size.
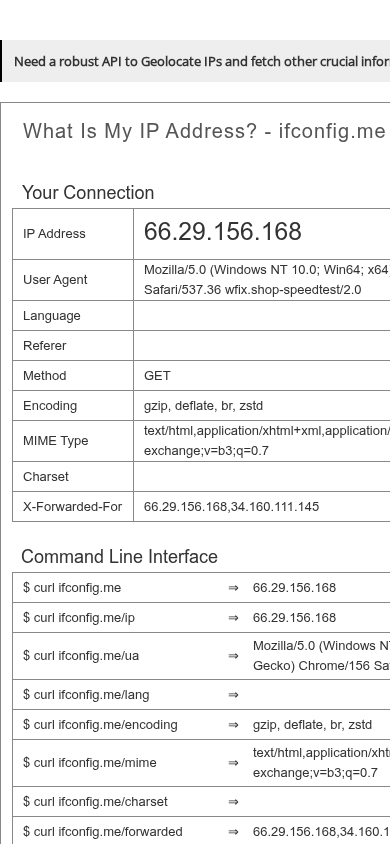
Browser render
The same URL loaded in a real browser, so these are the readings curl cannot produce. The grade above is still built from the server measurements.
Page weight by type
What the page is made of
Transfer size, compressed as sent. 6 request(s) in total, 37.7 KB across all of them.
Top issues
Compress text responses
high impact0 text response(s) of 10 KB or more are sent uncompressed, and the document itself is compressed. That is 0 B of compressible text.
Fix: Turn on brotli (preferred) or gzip for text/css, javascript and text/html in the web server. This is the cheapest win available on almost any site.
Serve everything over HTTPS
high impact2 asset(s) are still requested over plain HTTP.
Fix: Redirect HTTP to HTTPS at the server, and rewrite the remaining http:// asset references so nothing depends on browser upgrading.
Strict-Transport-Security
low impactHSTS is not set, so the first visit on a hostile network can still be downgraded to HTTP.
Fix: Send Strict-Transport-Security with a max-age of at least six months. Add includeSubDomains once every subdomain is HTTPS.
Waterfall
Slowest requests
Each bar is one request's own response time, scaled to the slowest. Assets were fetched in parallel, so the bars overlap in real time rather than stacking. first party third party
| Request | Type | Status | Time | Size |
|---|---|---|---|---|
| https://ifconfig.me/static/styles/style.css | other | 405 | 341 ms | 18 B |
| https://ifconfig.me/favicon.ico | other | 405 | 313 ms | 18 B |
| http://connect.facebook.net/en_US/all.js#xfbml=1 3rd party | other | 301 | 300 ms | 0 B |
| https://fonts.googleapis.com/css?family=Open+Sans&display=swap 3rd party | css | 200 | 286 ms | 229 B |
| http://platform.twitter.com/widgets.js 3rd party | javascript | 200 | 202 ms | 27.1 KB |
Report this page
Run this test on your own site
The same engine, free, with the screenshots and the fixes. No account needed.